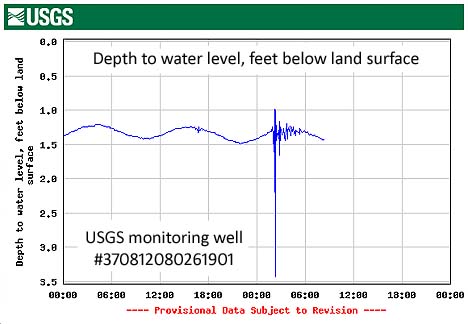
This site, from the USGS, shows depth to the water table for a well in Virginia:
You’ll notice the tidal influence on the water table (broad sine-curve-like up and down crests and troughs at ~12 hour intervals), and then a sudden perturbation which caused some wiggles almost two and a half feet of magnitude! This, presumably, is the seismic waves from the Chilean earthquake arriving — surface waves, I would guess, but I’ll happily be corrected if that’s not the case.
Major hat tip to Cian Dawson, who tweeted a link to the site around 6am D.C. time (which would be, what, 3am in California, Cian? Sheesh!). In the same tweet, a link to this hydrograph in Christiansburg, Virginia, showing its response to various historical earthquakes.

