
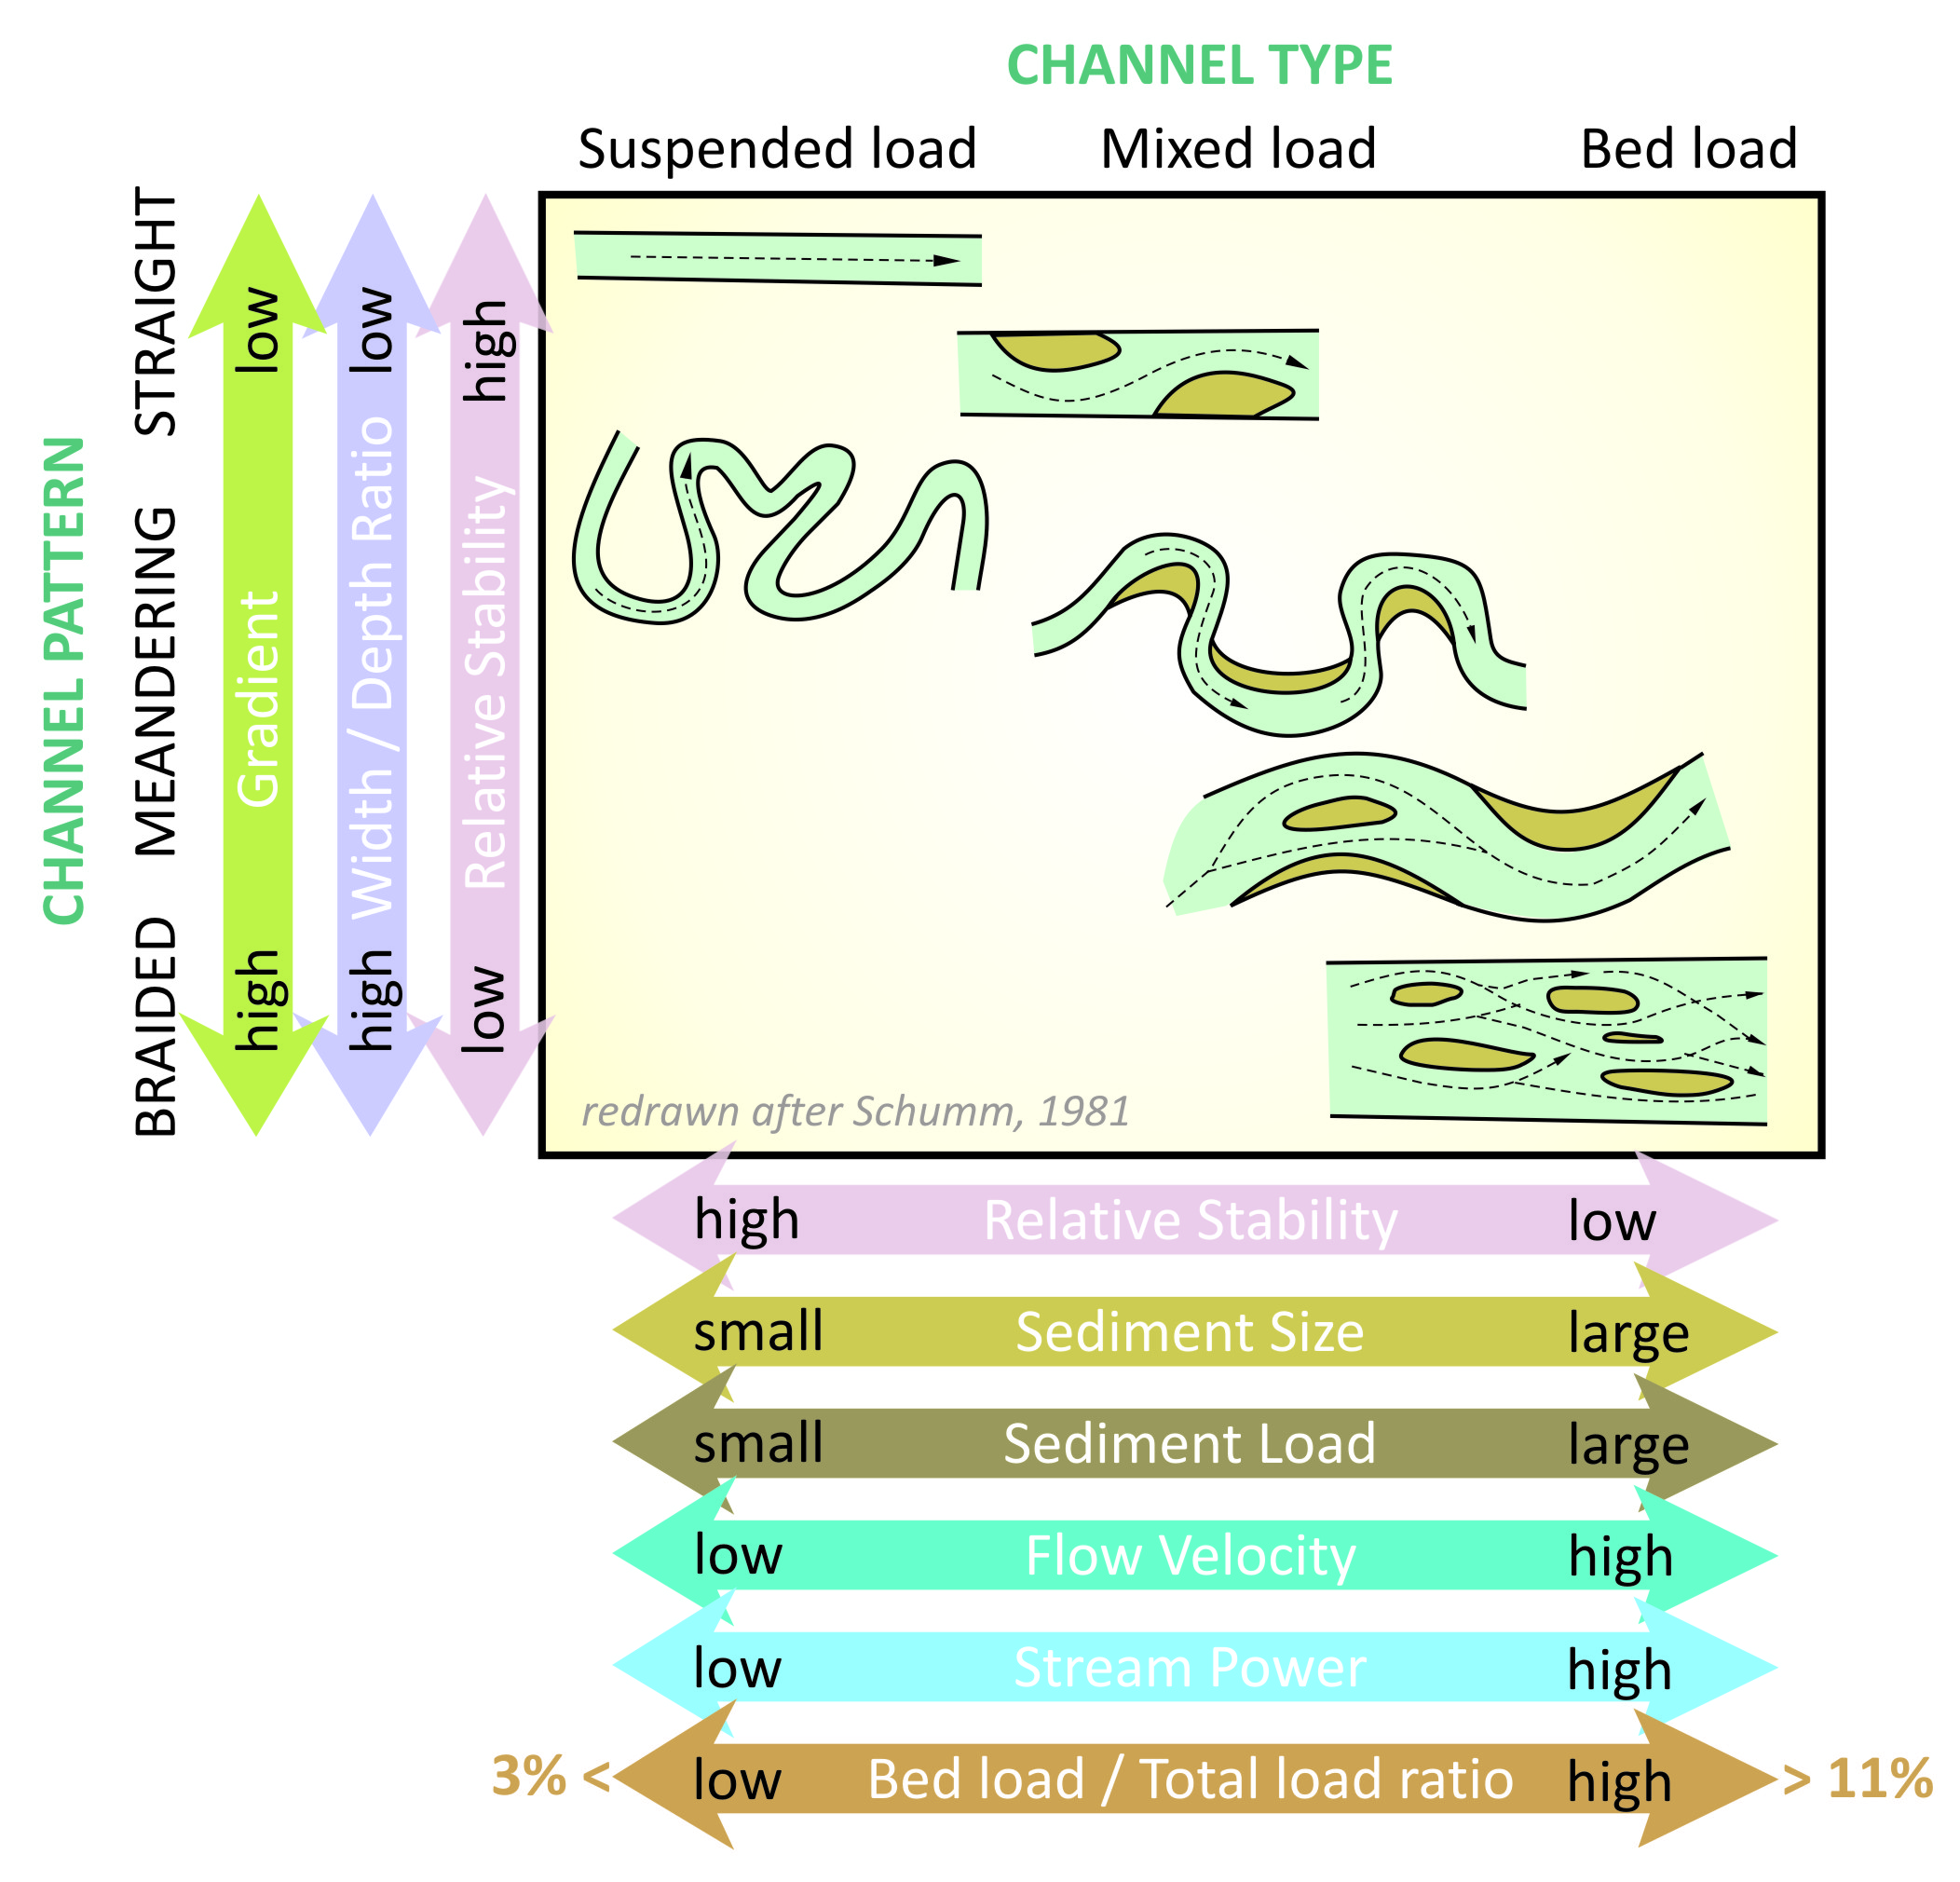
I really appreciated the feedback everyone contributed regarding the river evolution graphic I posted a week and a half ago. The latest offering is from Kyle House, who linked to a couple of nice summary images derived from Stanley Schumm. Because the images were low-resolution, and black and white, I decided to do some re-drafting. Here’s one (click through twice for full size version):
And here’s the original:

Images like this (and the previous, obsolete “river evolution” image) are central to the way I teach — a nice summary picture that compares variables. This one is more complex than I consider ideal, but I think it will do the trick.
I’d like to thank everyone who contributed to the discussion. I felt that this episode was a great example of how blogging benefits its practitioners. By putting my earlier graphic online, I got valuable feedback that corrected the erroneous and oversimplified way I was teaching about fluvial geomorphology. It was great to get critiques from both geomorphological and educational perspectives. That feedback has lead me to do some deeper thinking about that topic, and to change the way I teach it. Thanks — on behalf of myself and my future students!
Now for the new image… what would you critique here? (…either in terms of Schumm’s original ideas, or my redrawing of them…)
EDIT: Michael M. pointed out in the comments that several of the arrows were too low contrast to be legible. Funny, those colors totally aren’t what they looked like in the Corel Draw drafting stage! Anyhow, I’ve darkened them up a bit in this version:
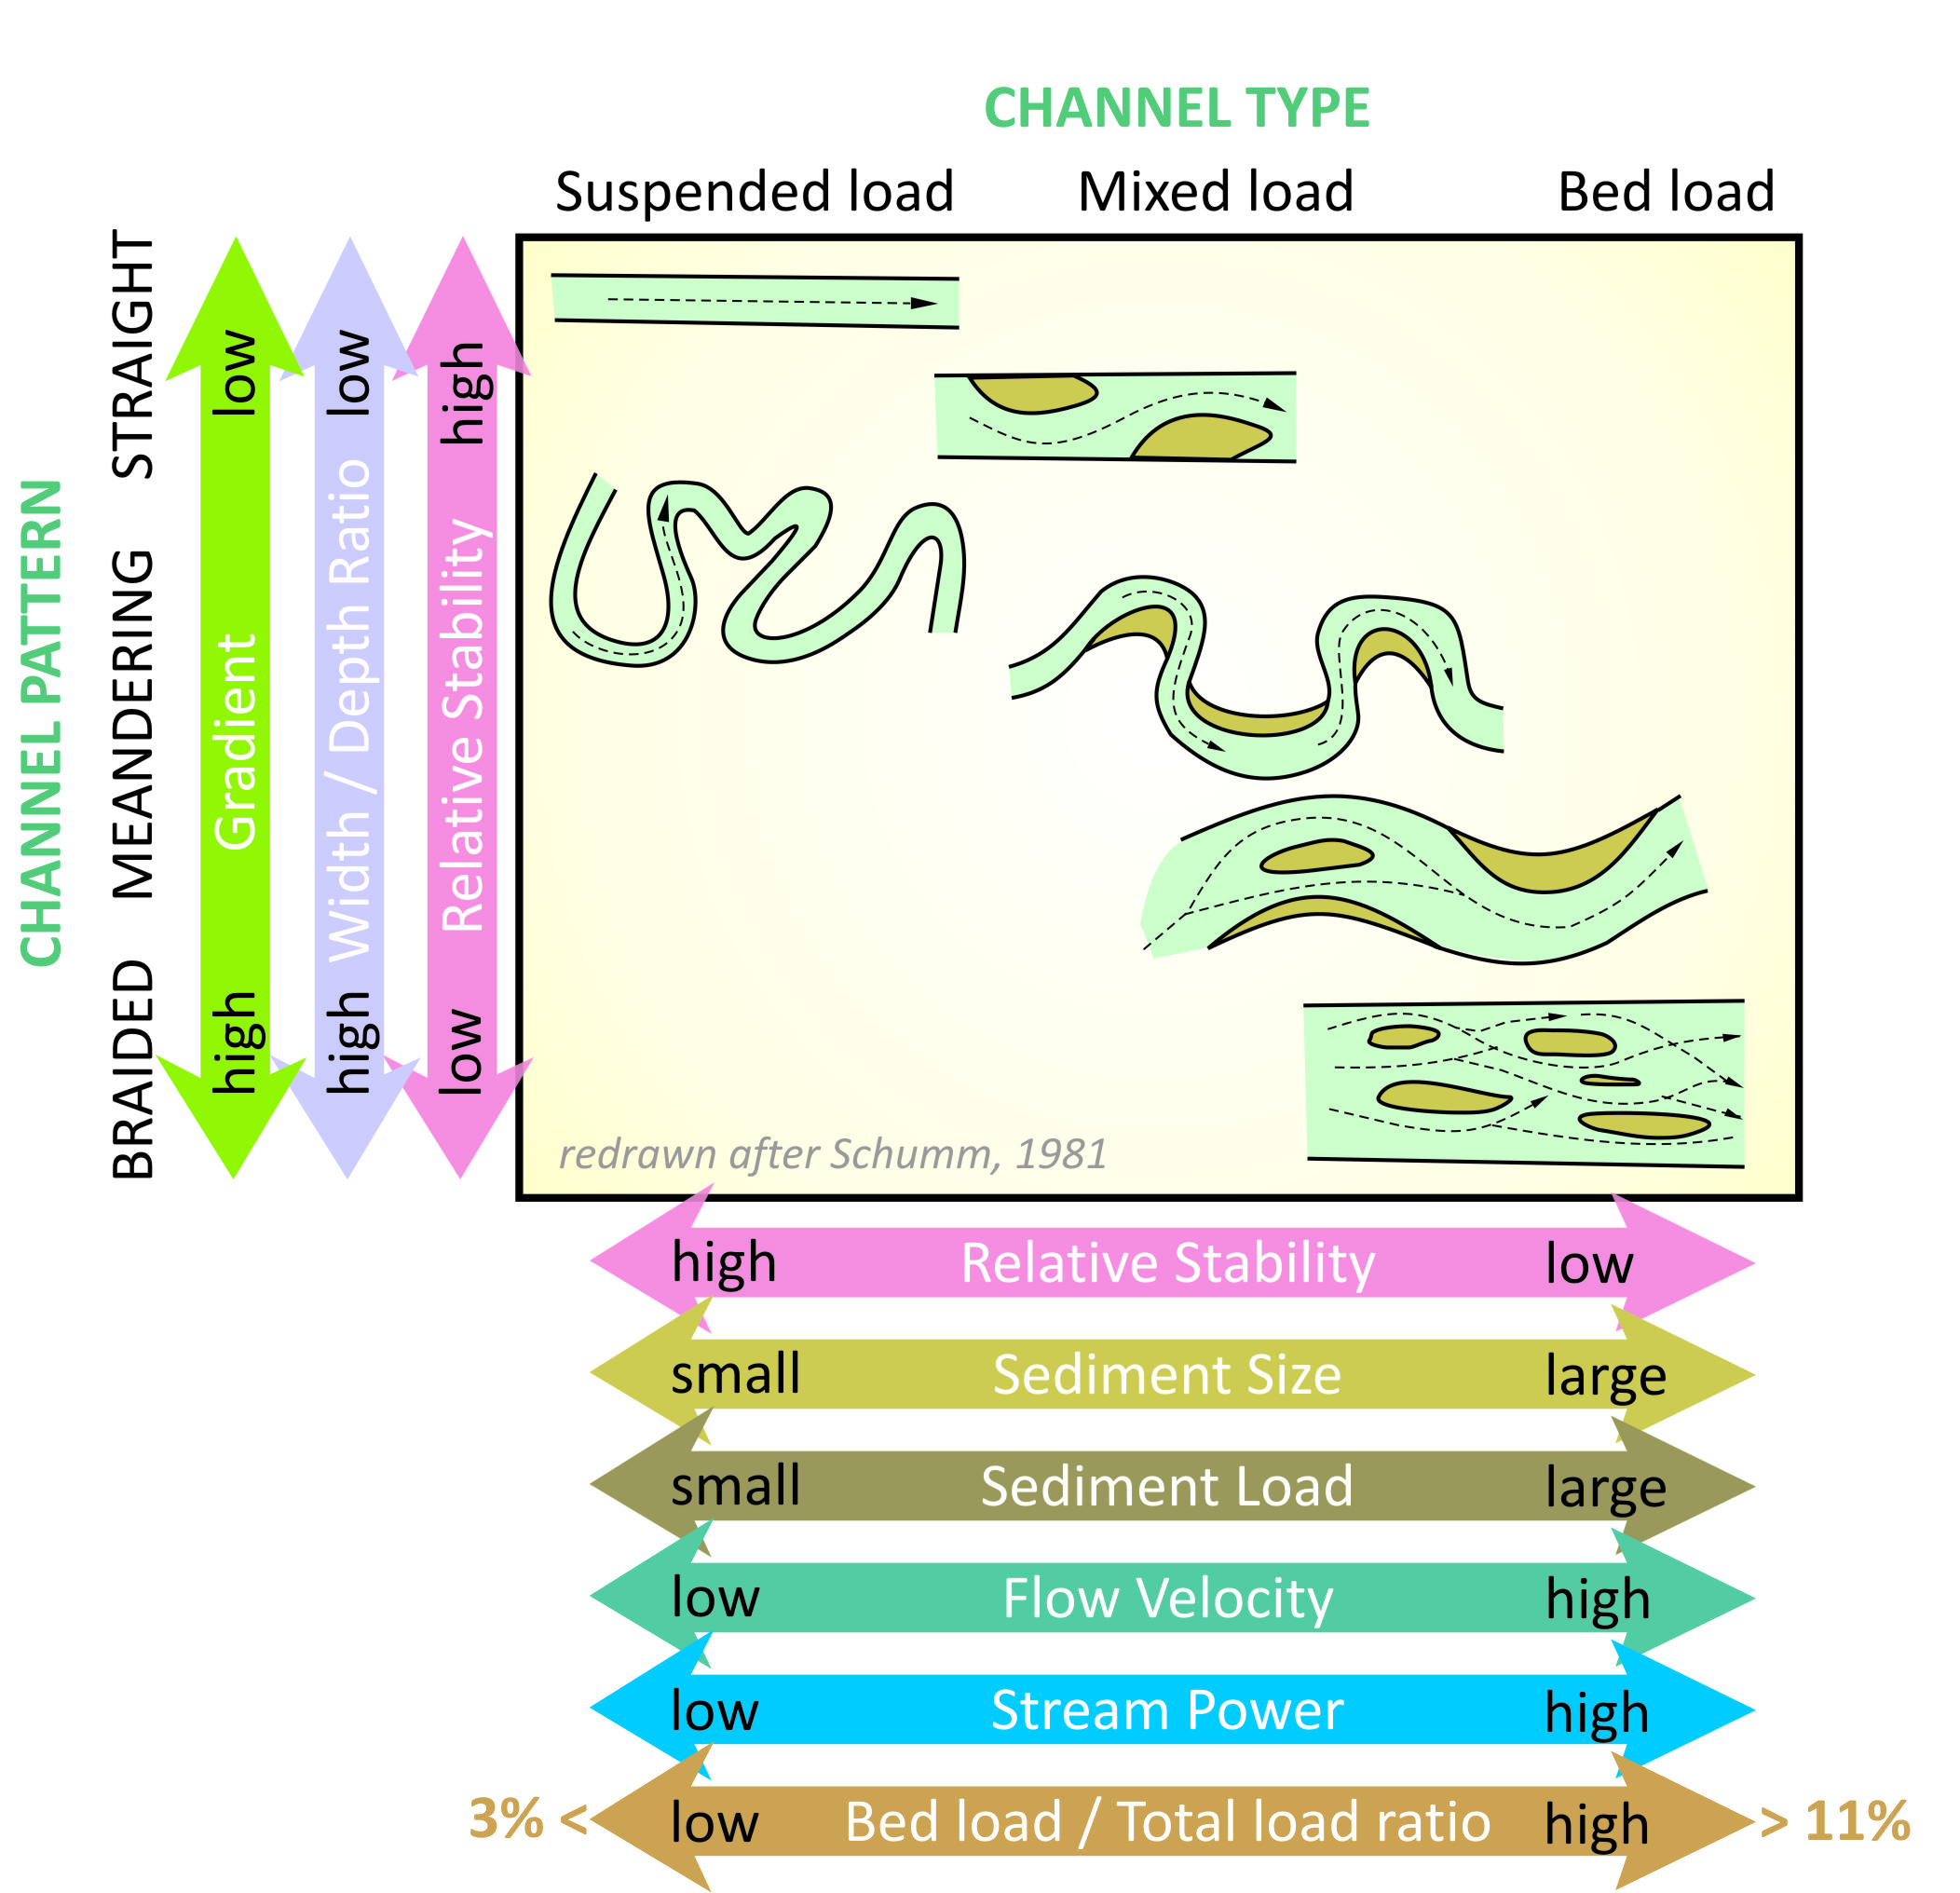
your white letters on blue/green/cyan arrows are unreadable.
Possibly unprintable also. It is difficult to get proper color contrasts when using a lot of colors. Been years since I’ve looked at this but there used to be good websites dealing with the color combination issues.
Thanks. Good point. I’ve darkened them up. A note on the printing comment — I designed this one for the screen, not the printed page. I could create a black and white version for printing, but I’d have to re-think all the fills to make that happen.
Nice graphic. The pale colors of your first version may be caused by the color profile in the Corel Draw settings. Do you have checked if you use the rgb instead of the cmyk profile? Images exported with the cmyk profile look much paler at the screen.
Good tip, Lutz! You’re right — I was exporting in CMYK rather than RGB. Never again!!
I am hesitant to jump in because you’ve opened a big can of worms. I think offering students generalizations like this can be very useful; like comparative anatomy in biology. But river geomorph is hideously complex and I find these generalized patterns break down with real-world application; I saw almost all these patterns today in an Ozark stream. They were dependent on human changes; gravel mining, slab bridge crossings, riparian vegetation clearing. And a fault crossed our site–this converted a joint controlled pattern to a tortuously meandering one.
Regarding colors, I’d defer to Tufte; make your arrows/text grades of beige or gray. And RE stream power, I’d either leave it out or correct it by making it “specific” stream power (e.g. power per unit bed area). Total stream power (for a cross section) is much higher for low gradient, meandering lowland rivers because their discharges are much higher.
OK, I’ve addressed maybe three worms in that big can!
Thanks, Steve!
I appreciate the comments, especially given your expertise. Fluvial geomorphology is not my specialty, and I am really benefiting from the discussion. So: Given that river geomorphology is complex, my question is “How should I teach it to an introductory audience?” (I’ll bet Steve would suggest using an Emriver instead of a still image!) In the previous iteration of this discussion, Kim Hannula suggested focusing on processes. I think processes are great, but I can’t help being a visual person, and I like teaching from images. Let me challenge you (or anyone else who is up for it) to suggest an image or two or five which would make for a good visual on which to base a discussion. Perhaps I’m off base with my devotion to static images, but I’m curious to know whether there exists an image that (a) introduces relevant concepts effectively and (b) no one would quibble with.
As for the colors, yes, there are too many, and yes, Tufte Would Frown. I was trying to preserve the information in Schumm’s original but make it more accessible by saying “lots of variables plot along theses axes,” and grouping sedimentary variables together with shades of brown, and water flow variables together in shades of blue. Perhaps it’s information overload. Another tweak I might make is to lose the arrow heads, and just make “tape arrows” instead (no barbs), since the barbs overlap in a somewhat visually disconcerting way.
Can of worms? Bring it on! I think it’s great to discuss these things… especially considering how mystified I am about the right way to approach this with my students. I’m willing to reflect on the worms… Let’s dump them out!
Who else wants to chew on a worm?
It’s been a long time since I read this publication. I’m not super plugged into basic fluvial curriculum at this level now; but I know that at higher levels generalizations like this are not much used anymore (well, except for the “Rosgenite” consultants, we’ll set that aside for now).
When I see this all I can think of are contradictions to it. E.g., increased sediment supply compared to what? Can you compare the meandering lower Mississippi’s sediment load to a 1-meter wide braided channel? What variable stays the same and which ones change? Who’s got the higher sediment load? And what’s the definition of stability? If you use morphological change, then perhaps it’s a good generalization, but if you use the sediment balance entering and leaving a reach (my favorite definition of stability), then it falls apart.
When students see these (and the old “braided, meandering, straight” graphic; they immediately assume that you can change one variable and move around in the chart, e.g. if you simply increase coarse sediment supply you can go from meandering to braided. And of course that’s not true; there are many interdependent variables. In the Emriver you absolutely can do some of these things, though, precisely because you CAN control just one variable (e.g. slope or discharge).
That’s why the Emriver is a good *process* model, but we caution users that that’s not the same as a *predictive* model; which brings us to my problems with your graphic; you have to be clear on what basis the comparisons are being made, and what assumptions are used. That’s the big nasty can of worms that will probably swamp its utility for basic teaching.
Now my brain hurts, Callan, and I’ve barely scratched the surface of this issue!
Callan,
Sorry to fall into this discussion so late, but I’ve just returned from my little trip to Mongolia and I’m still adjusting. Now there’s a place for landscapes!!
I was struck by your statement:
My experience is that many people begin their engagement with geology with the question of “Why does this landscape look the way it does?”
I tried persistently to organize my courses going from the concrete to the abstract, thinking that was the best pedagogical approach for the GE/Intro students in my CC classes. That lends itself to starting with landscapes and ending with tectonics. But that is not the way the textbooks are written and it is very hard to not use the sequence of chapters as the writers present them, no matter what they say.
The single exception to that generalization about textbooks that I know about is R. R. Compton’s “Interpreting the Earth” (1977). It starts with the SF Bay Area (Compton’s a Stanford man), and goes through the James River system in Virginia arriving at Plate Tectonics in Ch 19 and 20. Rocks and Minerals are in supplemental chapters. Davis-type erosion cycles are not mentioned.
Looking at it now,it strikes me as the kind of book an established professor would write just for the sake of doing it the way he/she thought it ought to be done. Perhaps that’s a little like blogging.I don’t believe a subsequent edition ever came out, but you can get it for less than $10 through Amazon.
River processes did become an important part of my teaching and I have said some stuff about that (Meandering across the digital divide III: Pedagogy of a meandering stream. November 9, 2009 on my blog under the subject The Digital Divide.
George D Turner
eclecticplagiodoxy.wordpress.com