
I scored this photo off the Internet more than five years ago, the first time I taught Structural Geology at George Mason University. I failed to note the website I got it from, and now it apparently has disappeared, at least as far as the view from Google is concerned. If anyone knows the provenance of this image, please let me know so that I can properly attribute it.
I hesitate to post something like this without knowing who took it, but I did note to myself that it came from the Point Lake Greenstone Belt in the Northwestern Territories of Canada. This image and its implications follow so nicely on to our discussion last week about fold wavelength and the Ramberg-Biot equation that I can’t resist it. Ready? Brace yourself…
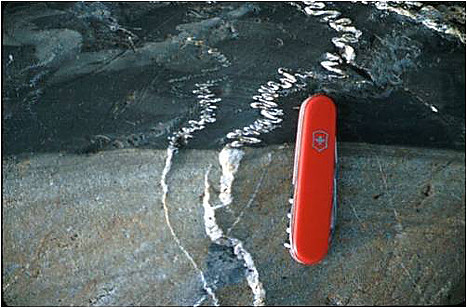
I think that this is one of the coolest structural geology photos ever taken. Here it is graced with some annotations:
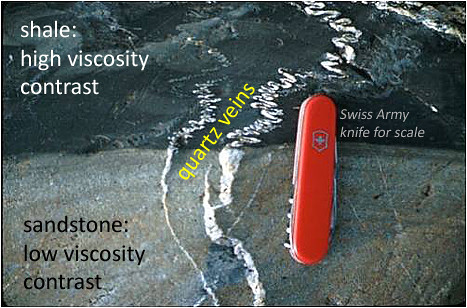
Maximum compressive stress was in this case from the back to the front. The same vein, oriented ~parallel to σ1, is folded in two very different ways, depending on which rock type it is cutting across. As with a week ago, we can explain this behavior using the Ramberg-Biot equation:
L = 2 π t (η / 6ηo)⅓
where L is the wavelength of the fold (in other words, the distance from one fold hinge to the next fold hinge); t is the thickness of the folded layer; η is the viscosity (resistance to flow) of the quartz vein (or, in general, the more competent of the two layers); and ηo is the viscosity of the sandstone and shale that the quartz vein cuts across.
If you keep t and η constant (for say, the rightmost of the two quartz veins), then the only thing left to vary would be ηo. So sandstone will have one ηo, while shale will have another ηo. The sandstone is more resistant to flowing than the shale is. The viscosity contrast between the quartz vein and the sandstone is less than the viscosity contrast between the quartz vein and the shale.
The high viscosity contrast with the shale makes for a very big number, which raised to the ⅓ power (i.e., you take the cube root) makes for a very small number. This small number, multiplied by the constants of 2, π, and t, gives you L, which will also be a small number: hence the wavelength is small, and as a result, the folds are crunkled up next to one another like sardines in a can.
On the other hand, the low contrast between the viscosities of the quartz vein and the quartz sandstone means that you get a rather small number. Say η = 3. If ηo is also about 3, then you have: (3/(6*3)), or the fraction 1/6. Expressed as a decimal instead of a fraction, this is 0.167. Take the cube root of that, and you end up with a bigger number, in this case 0.55. Multiply that by 2, π, and t, and you get your new wavelength, L. Because you have a larger number in the (η / 6ηo)⅓ part of the equation,and everything else is the same, you end up with a larger wavelength, and only one fold antiform in the sandstone. In the neighboring shale, ~23 antiforms are packed into the same distance along strike of the vein.
Wild stuff, right? Happy Friday. Let’s hope your weekend is of sufficiently high contrast to the sludge of the week that you get all loose and wiggly, like the top part of the photo… : )
Very nice! It’s always neat to watch students realize just how “squishy” shale is. Looking at a big outcrop of shale, it’s important to realize that it will compact much more than sand.
Quick math check, in a rush before class without enough coffee:
The cube root of a bigger number should still be larger than the cube root of a smaller number.
The difference might be in the other effect of low viscosity contrast – there should also be thickening of the layer. (I just looked up the equations, because I don’t usually do folds quantitatively in lecture. There’s a modified Biot-Ramberg equation that includes strain of materials with a low viscosity contrast – p. 260 of van der Plujm’s textbook.)
But I’m not totally convinced that’s what’s going on in the picture. The vein in the sandstone has some features that look like brittle fracture propagation (the thin tip of the vein on the right). Which means… well I don’t know, and it’s time for class. (And my class isn’t to the point where we could argue about it, unfortunately – we haven’t gotten to brittle fracture yet.)
Certainly the quartz vein started off brittle — I think it would be reasonable to interpret that little tip to the branch of the right vein as “pre-folding.” Maitri makes a good point below about the lack of context… Another thought is that maybe our assumption of constant thickness of the original vein is unwarranted.
Hmmm… Kim is right about the math. I didn’t take it far enough.
No viscosity contrast example (i.e. sandstone):
η = 3 poise and ηo = 3, then η/(6*ηo) = 1/6
1/6 raised to the 1/3 power is 0.55
Multiply 0.55 by 2 and by pi, and you get 3.45
Multiply 3.45 by your stiff layer’s thickness, and you should get your fold’s dominant wavelength.
Large viscosity contrast example (i.e., shale):
η = 1000 and ηo = 3, then η/(6*ηo) = 55
55 raised to the 1/3 power is 3.82
Multiply 3.82 by 2 and by pi, and you get 23.97
Multiply 23.97 by your stiff layer’s thickness, and you should get your fold’s dominant wavelength.
…but that’s a bigger number! What am I messing up here?
As Davis & Reynolds put it on page 407 of their structural geology text, “folds and folding continue to keep us humble.”
I’m flummoxed. Anyone else want to chime in?
I am going to venture a guess here and say that it’s a simple case of strain accommodation with brittle deformation in the sandstone (faults) and ductile deformation in the shale (tight folds). Unless we see more of the formation in question and observe a) more larger-wavelength folding in the sandstone and b) actual thicknesses of the units, it’s hard to say more about what’s going on in the picture.
This reminds me of folds discussed in…
Fink, J. H. and Reches, Z. (1983), Diagenetic density inversions and the deformation of shallow marine chert beds in Israel. Sedimentology, 30: 261–271. doi: 10.1111/j.1365-3091.1983.tb00669.x
The observed folding, ultimately, is attributed to density, rather than tectonics.
Great blog!!!!
The photo is awesome!!!
Okay, first, in our case viscosity of layer is lower than that of matrix.
So, in this case we have (as you stated good with Ramberg-Biot equation):
L increases as:
1. Viscosity contrast increases
2. Layer thickness increases
That means that there’s an ERROR in your example (in comments, shale case):
η =3, and η0=1000 (viscosity of shale); which means viscosity contrast is HIGH!
=> η/(6*ηo)= 0.0005 raised to the 1/3 power = 0.079 =>
0.079*2*pi*1 (e.g. thickness of the folded layer) => L = 0.49
In your case L (in shale) = 0.49 < L (in sandstone) = 3.45
And that's the Ramberg-Biot equation!
@J.C.Chang
The observed folding is very much related with tectonics! 🙂 The fold style is another issue.
@Callan Bentley “folds and folding continue to keep us humble.”
Exactly! But it's interesting… 🙂
I appreciate your effort to resolve this, Mario. The thing is that the bigger “η” number represents a higher viscosity (a greater resistance to flow). Viscosity is measured in units called poise, centimeter-gram-seconds of flow.
To give a sense of what a poise feels like, consider some example viscosity measurements are provided in the terrific book Reading the Rocks by Marcia Bjornerud:
…Water (room temperature) 0.01 poise
…Blood (room temperature) 0.03 poise
…Motor oil (room temperature) 10 to 20 poise
…Basaltic lava, Hawaii (1000°C) 100 poise
…Rhyolite, Mt. Saint Helens (800°C) 10,000,000 poise
…Glacial ice 10,000,000,000,000 poise
In other words, by definition, η > ηo.
In the high viscosity contrast case, if you have one rock unit with a viscosity of 1000 poise, and another with a viscosity of 3 poise, then η = 1000 and ηo = 3. “η” has to be the bigger of the two.
…But upon further reflection, I think I’ve got it:*
The “L” result (wavelength) is the INITIAL wavelength as the unit begins to fold, and as differential compression causes shortening of the quartz vein along strike, this “initiation” wavelength decreases, and you get a more and more ptygmatically folded vein. As the wavelength goes down, the amplitude goes up. The initiation wavelength is not the final wavelength, because the rock unit that is less resistant to flow will flow out from between the deforming slabs of stiffer folding vein. This gets the fold limbs closer together, and the wavelength will decrease with progressive folding.
*…or at least I’ve got a better handle on one aspect of this problem that was tripping up my thinking.