
Just wanted to call your attention to two new maps showing GPS displacement vectors from Japan. (Barry left links to these images in a comment yesterday.) These images are hosted on the website of the Geospatial Information Authority of Japan, and though I can’t read the Japanese to verify their authorship, I presume that agency produced them as well. They are easier to read than the one I posted on Saturday morning, and they include additional information about the vertical component of displacement.
Horizontal motion between March 1 at 11pm and March 11 at 3pm:
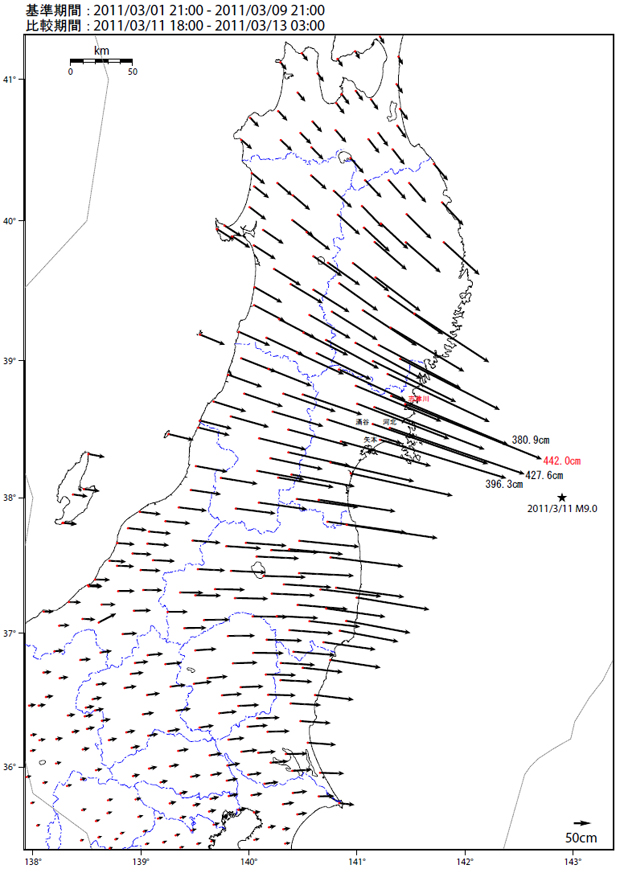
The biggest one shows a maximum displacement of 4.4 m! And this, keep in mind, is on the land-based receivers on Honshu. (Of course, there would be more displacement on the seafloor closer to the epicenter, but we don’t have GPS receivers mounted there. If this is your first time looking at one of these maps, let me point out that the arrows are not drawn at the same scale as the underlying map. A scale for the base map is in the upper left, and a separate scale for the GPS-measured displacement vectors is in the lower right.
Here’s vertical displacement between March 1 at 11pm and March 11 at 3pm:
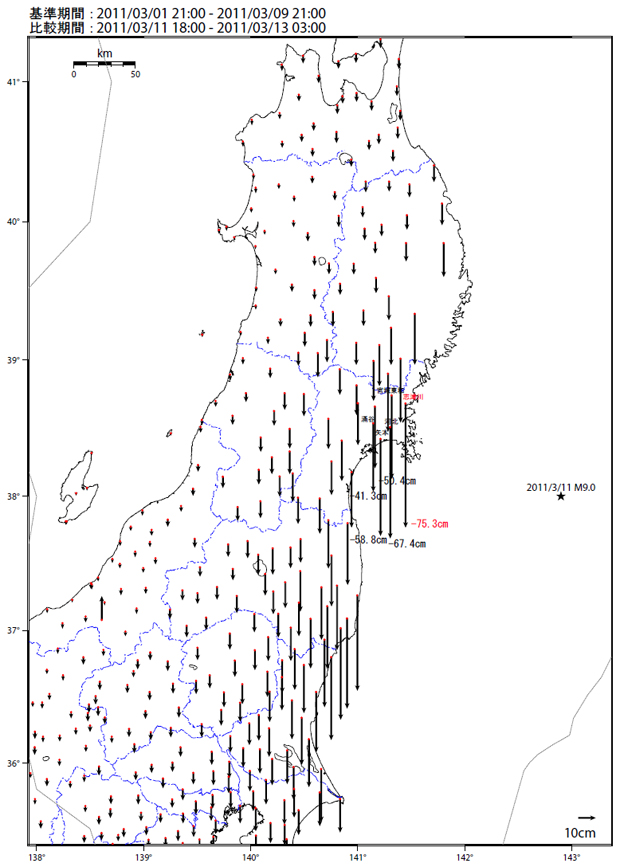
At first, I found it surprising that the land dropped in elevation, in some places by as much as 75 cm (~2.5 feet) as a result of the quake. Initially, I would have guessed it would increase in elevation instead, since northern Honshu is climbing up relative to the subducting Pacific Plate beneath it. Upon reflection, however, what I think was happening is that the crust beneath Honshu was flexing upward as stress built up on the fault (i.e., before the earthquake), then at the moment of slip, this “arched” crust of Honshu relaxed back into a wider, lower configuration. That’s also the interpretation presented by this video, which I highly recommend watching if you haven’t already.
[youtube=http://www.youtube.com/watch?v=RVaDXsqLUtI]
That also would explain some of the lingering flood effects shown in these before/after satellite images of the coast of Sendai: the shore is lower than it was before the quake!
The Sendai Supersite shows a plot of displacement as measured in the vertical dimension, latitude, and longitude, for a GPS measurement station at Mizusawa, a city north of Sendai on Honshu. According to the description on that web page, this is work done by a graduate student named Simon Banville at the University of New Brunswick. Please consult the Supersite for a full list of credits for this work, including information sources. I’ve redrawn his figure (to make it display better in this space) here:
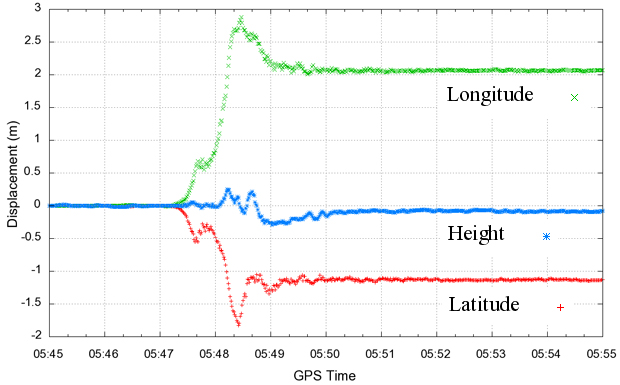
The vertical axis of the plot shows displacement in meters (1 m = 3.28 feet). The horizontal axis shows the passage of time. For Mizusawa, the action starts at 5:48 and ~20 seconds GPS time. Overall, the plot shows the station moving 3.5 meters (11.5 feet) to the east-southeast during the first minute of shaking, and then shifting back a bit, ultimately coming to rest at a final position 2.3 meters (7.6 feet) east-southeast from its pre-earthquake location. This adjustment takes about two minutes, during which waves with amplitudes approaching a quarter of a meter (~9 inches) roll through.
So Mizusawa ends up ~10 cm lower in elevation as a result of this event. I wonder what a similar plot would look like for Sendai itself, given those -75 cm vertical displacement vectors on the coast…
I’m grateful for scientific agencies and geology departments like the Japanese Geospatial Authority and the University of New Brunswick for sharing this information with the world via the Internet immediately after a big event like this. It helps the rest of us immeasurably in coming to terms with the magnitude of the event.
What are your thoughts on these displacements?
This link from the USGS http://earthquake.usgs.gov/earthquakes/eqinthenews/2011/usc0001xgp/finite_fault.php suggests up to 18 meters of displacement along the fault.
Nice find, Callan. And you’re exactly right about the cause of the subsidence – it’s due to the release of elastic strain built up on the locked subduction thrust before it ruptured. One of the key bits of evidence for the 1700 Cascadia earthquake is lots of trees drowned by subsidence and flooding of low-lying areas following the rupture.
I remember a great documentary about the trees in Cascadia, but I can’t actually recall its name!
Anyway: an intersesting paper about the drown trees in Cascadia:
Jacoby, Bunker and Benson, “Tree-ring evidence for an A.D. 1700 Cascadia earthquake in Washington and northern Oregon” Geology; November 1997; v. 25
http://blog.lib.umn.edu/stgeorge/geog5426/2010/11/13/Jacoby%20Geology%201997.pdf
Cheers
J.
And there was widespread subsidence of floodplain areas during the New Madrid quake. Lots of low seasonally flooded wetlands became permanent lakes, notably Reelfoot Lake in Tennessee. Probably a different process — consolidation of “fluffy” young sediments, but it’s a complex processes.
could the fact the coast dropped 2.5 feet be an explanation as to why the walls that should have been high enough did not keep the tsunami out of so many cities?
Sounds logical, at least as a partial explanation for the over-topping.
Very good point; 2.5 feet is a lot of vertical drop in a flat landscape (that would greatly affect flow energy) and is approx. the safety factor built into key levees.
Thank you so much for this. It is the exact question I was wondering about. The results are very similar to the evidence found along the Washington coast as well as a number of other subduction zone quake sites.
I have a few photos of subsidence from the Cascadia quake http://washingtonlandscape.blogspot.com/2011/03/policy-considerations-for-washington.htmlhttp://washingtonlandscape.blogspot.com/2010/01/washington-state-coast-is-located-along.html
The coseismic subsidence is very dramatic. People were tricked into believing everything was all right and and built near the ocean thinking they were safe. Not knowing, they were being uplifted by the distortion-deformation from locked plates, so happy with ocean proximity and ocean views. Coseismic subsidence sure put real estate underwater fast and ruined the beach front homes with ocean views. It is wonderful that plate tectonics science helps us find out what is going on and warns us of the risk of subduction earthquake, coseismic subsidence, and tsunami.
but, it is alarming to people who find out their home is in the great subduction earthquake with tsunami and subsidence zone. As interseismic deformation-distortion of Cascadia’s stuck plates increases through the years, people will wonder more and more about what happens, such as foreshocks before the great subduction earthquake. It is very coincidental that tectonics researchers Yumei Wang and Chris Goldfinger were at a conference in Tokyo during that time and Chris described his March 11 earthquake experience after he got home to Oregon State University by March 13. I am sure the experience helped in their understanding.
I have seen pictures that show the same sort of thing happened in 1964 in Alaska, where for example the railroad ran along the shore, and now runs between the shore and salt marshes.
In Geological Society of America Bulletin November/December 2010 article Rupture area and displacement of past Cascadia great earthquakes from coastal coseismic subsidence by Leonard, Currie, Mazzotti, and Hyndman, on p. 2079 “Along much of the Cascadia coast, the subduction earthquake cycle results in gradual interseismic uplift and abrupt coseismic subsidence as the upper plate slowly shortens and upwarps due to locking of the plate interface and then release of the accumulated strain during great earthquakes.” When we have our next great subduction earthquake, the displacement from coseismic subsidence will be very valuable research. Research on the Sendai subduction earthquake coseismic subsidence confirms a similar deformation motion of East Coast of Honshu.
The experience of life forms such as humans experiencing the great earthquake with unconsolidated sediments at or near the beach and liquefaction with sand boils and sand dikes, as well as subsidence hopefully will be able to evacuate before the tsunami, water of which is of such high energy as to suspend sediments, tear loose, abrade, and tumble everything as it moves in. It is hopeful that people will be forewarned and evacuate before that happens, and less real estate developments, industry, and no nuclear plants to experience the liquefaction, subsidence and tsunami and end up in a mess like along the changed shoreline of East Honshu.