
The USGS reports more aftershocks, so your humble graphing servant has responded with a plot that updates the images I showed you last week. Here you go:
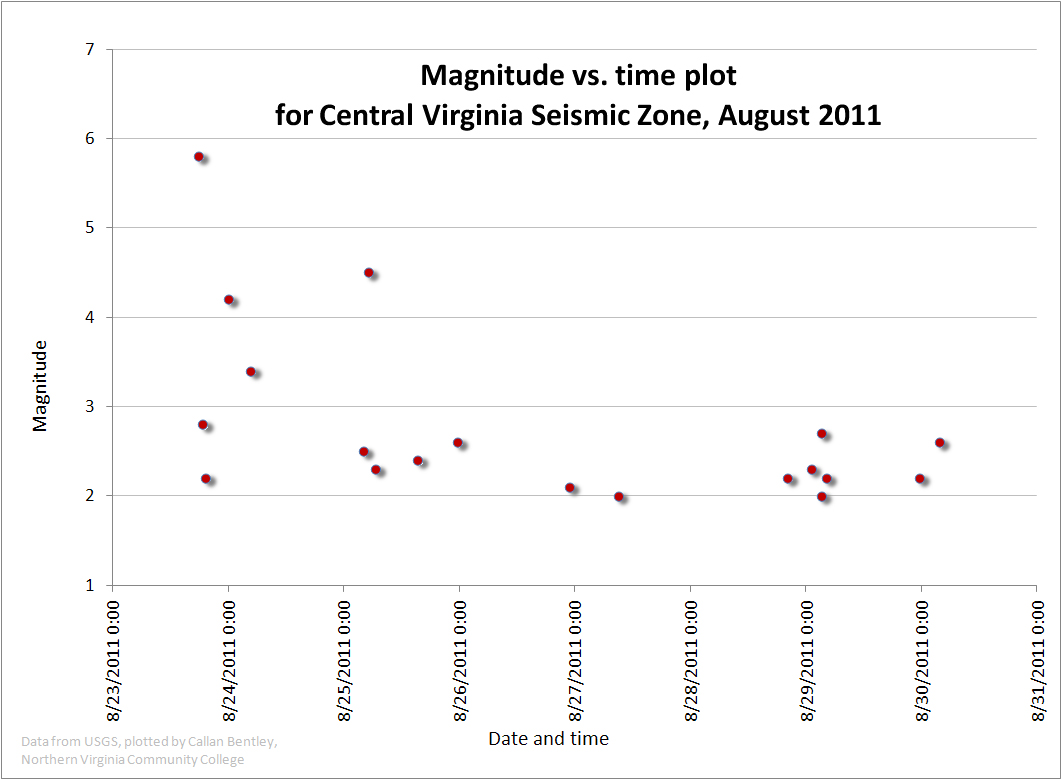
Embiggable, via a simple click.
Again, the “decay” pattern jumps out at us. One thing that I’m also noticing is how there are no events below 2.0 magnitude. What’s up with that? Simply not detectable? …or not worth bothering with?
By the way, there’s a USGS aftershock map, but the talented geophysicist and graphic artist Kelsey Jordahl (who made this) pointed out that the USGS map doesn’t match the available USGS data. When plotted anew, you get a different distribution. Not sure what’s going on with that, either. Any ideas out there?
Magnitude 2 must be the detection limit for the national seismic network in the Virginia area. Only in places with densely spaced seismic stations can smaller events be located.
The NEIC updates the earthquake locations when they get additional information, so the initial location won’t be the same as the “final” location.
It’s definitely that the different searches are using different solutions. I think that the first link you site uses the most recent solutions (and they may change with time as events get reviewed). The other link I sent you seems to use the QED (Quick Epicenter Determinations) solutions, the automated locations that are immediately released. I was surprised that those hadn’t been updated in the search I did.
Also, the uncertainty in position is generally 2 km or more for most of these events.
I haven’t yet seen a map of what they recently installed. By the old distribution of seismometers, they could be quite out by 10 km or more. I remember a small earthquake in Buffalo, which the USGS had 30 km away from the felt area, and our location with the Southern Ontario Seismic Network (SOSN).
Had this been in Canada, we would have quickly put in an array of Polaris instruments which use satellite and solar, and can be dropped anywhere. Maybe the usgs could pull some Earthscope instruments?
USGS has said they are deploying portable instruments to better characterize aftershocks:
http://www.usgs.gov/blogs/features/2011/08/23/5-8-earthquake-in-virginia/
I would suspect that we aren’t seeing the data from those instruments in the automated locations, but I don’t know that’s the case.
Hi Callan–why do the aftershocks plot in mainly an east-west direction instead of parallel to the presumed NE-SW-trending triggering fault? Error induced by the seismic array geometry?
Great question. I do not know. Error? New fault of a different orientation? Single fault plane, but different depths?
Bill: Also, check this out – maybe it’s a “margin of error” thing: http://www.flickr.com/photos/15605437@N08/6095870460/
Newest version of the aftershock plot is here:
http://www.flickr.com/photos/59999669@N03/6103661285/