
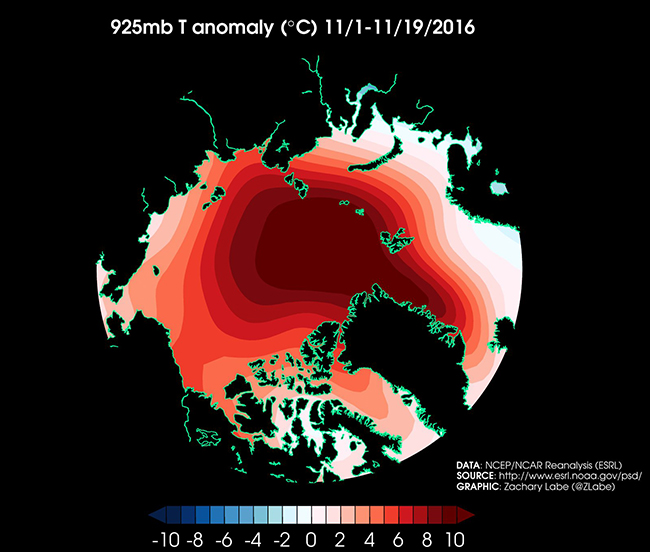
The amount of our planet’s ocean area covered by ice is at an unprecedented low for this time of year. It is the Arctic winter, the long night when no sun shines on that northerly ocean, and yet temperatures there are averaging 10°C above normal. My attention was called to this issue last week thanks to the Twitter feed of Zack Labe, a PhD student in Earth Systems Science at the University of California – Irvine. He makes great graphics showing the latest data on polar climate. Here’s his latest temperature map for the Arctic, for instance:
 Click for source
Water there is accordingly failing to freeze. Meanwhile, down south, the Antarctic summer is getting cranked up, and that sea ice is melting. When these two polar situations are summed, we see that there is less sea ice on Earth for this time of year than we have ever seen since we started keeping track of it. This graph, not by Zack by by Wipneus (click for source), shows the current situation in the context of the entire record:
 Click for source
Zack Labe breaks out each pole independently, if you’d like to see that:
Very odd… both NSIDC and JAXA daily numbers show another sizable loss of #Arctic sea ice extent in the last 24-hours… pic.twitter.com/VLNYHw5zFC
— Zack Labe (@ZLabe) November 19, 2016
This deviation from the trend of previous years is utterly anomalous. Will it turn out to be a unique diversion that we’ll end up chalking up to the mere vicissitudes of “weather?” Or is this what a tipping point looks like when it is finally reached?
Time will tell.
It also appears that the 2106 total ice level at the peak of the Antarctic summer was the lowest on record (but not by much).
Point me at your data. The graphs above do not show Antarctic ice solo, only Arctic solo and combined (global), area (not volume) in both cases.
This graph shows that the Weddell Sea basin had a 2016 peak, but the “total Antarctic” summation graph does not show a peak. Maybe you’re looking at different data than I am.
I was just making the simple observation on the Global Sea Ice Extent graph, the lowest value of ice extent is the red line (2016) in mid-February.
Aha. I see. Yep, you’re right.
Hmmm, 1978 to 2016. Not a whole lot of history to “the record” is there? Earth has been ice free most of its history with exception of the Quaternary, the Huronian, the Cryogenian, Andean-Sahara, and the Karoo. IMHO this is nothing to worry about and certainly the geologic record speaks for itself.
You’re perhaps aware that the dataset cited is the range of the satellite (direct) record. Proxy datasets go back much further, and teach us about numerous changes to the planet’s climate over its 4.5 billion year history. I’m not claiming that the current anomaly is unprecedented within that span, and neither am I claiming the planet Earth is itself at risk. My understanding of the Huronian, the Cryogenian, and the Quaternary inform my view, as well as what follows. I am claiming that the current anomaly is unprecedented within the period we have been actively directly observing, and I’m claiming that it’s likely unprecedented within the time our species has existed and civilization has grown and thrived. Would you challenge those claims? I would also argue that the rate of change currently observed is unmatched except during times of major perturbations to the Earth system (i.e., the PETM, the K/Pg event).
I’m pleased your view is so sanguine as to the resilience of the biosphere and the perpetuity of human civilization. Please justify that specific aspect of the situation? Thanks in advance.
Thanks for your question.
The point I am making here, is the data set covers no more than 40 years and you essentially have a one point anomaly which statistically, mathematically and geologically is meaningless. Even if you limit the period of comparison to the current interglacial 40 years out of that length of time is meaningless statistically. Using the term “unprecedented” only pertains to the fact that this phenomenon has not been observed in the time period records have been kept. You cannot extrapolate this single point of so-called deviation from the norm to mean much of anything. Whether it is anomalous depends on whether the trend continues. Have we seen other anomalies in this time period which correlate or could explain this deviation? Question to you and the Ph D candidate from California. Then, please define over what period of time you are calculating “rate of change”..
I think you can also leave the PETM and K/Pg out of this discussion from the standpoint that you are again comparing a single year of data (or 40 years if you wish) to perhaps 100’s of thousands of years. I point out that the changes with respect to the K/Pg probably took place over some 3 million years.
If one observes any natural trend, there will always be deviations from the “norm” (if you can define what the norm is) that may appear as spikes one side of the norm or the other. One single point of change is again not significant in the face of no other supporting data regarding a trend and 40 years of data is not significant over the length of the overall cycle it is supposed to sample.
Thom,
Thanks for your thoughtful and detailed reply.
I do not disagree about the duration of the satellite data set, and I agree that we have a “point” (really a month and a half, but let’s go with “point” so as not to split hairs) that is anomalous. What I do not necessarily agree with at this point is whether it is “meaningless.” I think that remains to be seen. As you point out, whether it remains anomalous depends on whether the trend continues.
The other thing that informs the discussion, and I assume is part of your overall mental picture as well as mine, is the state of understanding of modern climate science (as to expectations for sea ice in the Arctic and in the Antarctic). Given that understanding (the Arctic is warming, and may be a “canary in the coal mine” relative to the state of the global climate), it seems reasonable to pay attention to the latest satellite data as it becomes available and to see how it fits into the larger pattern, or deviates from it.
I see your point about comparing 40 years of data to a much longer span of time. It would be more ideal if we had tens of thousands of years of satellite observations of sea ice.
However, what else are we to do? We don’t have that imagery. We have: (1) proxy data for the Pleistocene and Holocene giving us a “field of view” of a couple million years of natural climate variation, and we have (2) 40 years of satellite observations during the period when an anthropogenic (“human-induced”) signal may be expected to be superimposed on natural climate variation. We have reason to suspect that the anthropogenic influence is sufficient to cause big changes, and we are motivated to pay attention to it since the implications/consequences are profound. Contrary to your assertion that “one single point of change is again not significant in the face of no other supporting data regarding a trend,” there is in fact a trend that has been empirically observed. The trend to which I refer is the overall loss of sea ice (a) area, (b) volume, and (c) age over the 40 year span of time we’ve been able to directly observe it. Surely you don’t dispute that?
Since this discussion was precipitated by a compelling graphical representation, let me share another, by Andy Lee Robinson, that shows this trend in the Arctic:
The Arctic trend is significant. The trend (loss of ~7.4% ice extent per decade) may be observed as the blue line in this graph from the National Snow and Ice Data Center.
The current anomaly, the one that prompted this blog post, is significant in that it is more than two standard variations from a 1981-2010 baseline average, as this plot from the NSIDC shows. It may not turn out to be a harbinger of things to come. It may be a “blip” in the longer-term record. That would be great. But it may be – if a self-amplifying feedback were to kick in, it would start with something like this. Therefore I see it as valuable to pay attention to.
In summary, I see the current anomalously low amount of sea ice in the Arctic (and therefore also globally) as (1) notable, (2) potentially worrisome given the climatic context in which it occurs, and (3) hopefully a mere blip in a system’s longer-term behavior.
Thanks for your comments.
Callan