
I believe in tinkering with my teaching, and reflecting on the new approaches to see if I think they’re worth keeping or not. One of the topics I teach is the geologic history of Virginia. I do this because it’s essential knowledge to put the students’ upcoming field trip in context, but it’s also a nice example of how geologic techniques can be applied to understand the history of a particular place. And of course, it happens to be the place where my students live – so it’s “home” in a very visceral sense.
Traditionally, I’ve presented this material as a lecture, the week prior to our field trip. However, this year I wanted to try something different. I was inspired by the “lecture tutorials” published by Karen Kortz and Jessica Smay. I’ve also been inspired lately by a semester-long professional development workshop I’ve been participating in, called SAGE2YC, wherein a bunch of great ideas have been tossed around.
So, here today I wanted to offer a brief report here about the approach I took to the Virginia geological history lecture. I passed out a handout at the start of the lecture that looked like this:
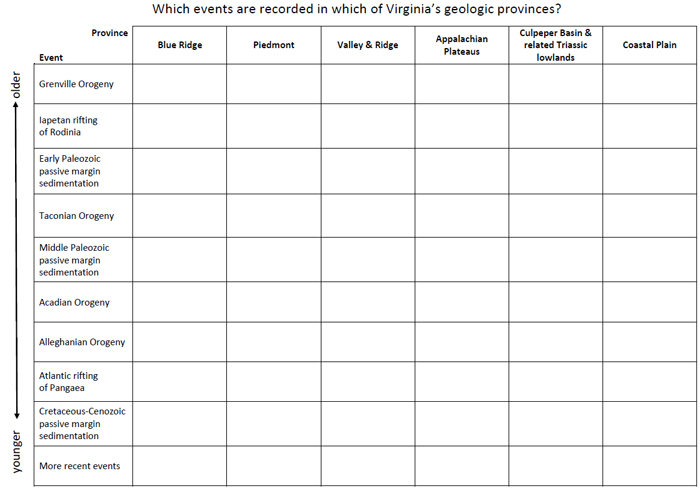
(click through for a full-resolution PDF)
And over the course of the lecture, I wanted the students to match up the different geologic events with the provinces in which they occurred, resulting in something that would look roughly like this:
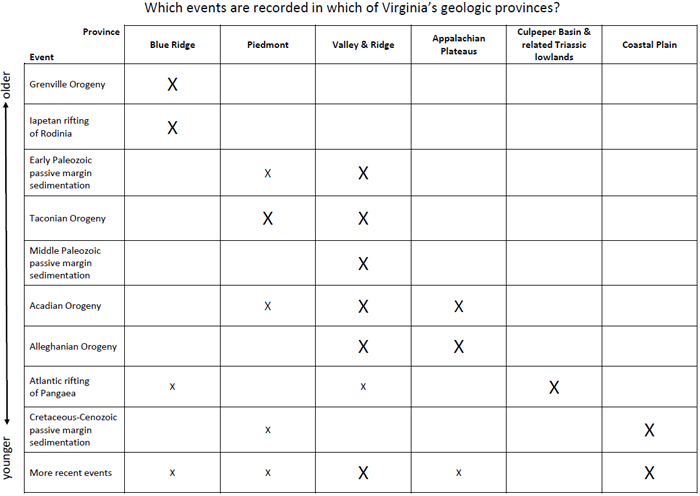
(click through for a full-resolution PDF)
It went fine, I think – it gave students a “puzzle” to solve during the lecture; like bloodhounds, they sniffed the lecture’s content for clues to fill in their chart. And we reviewed it at the end to make sure everyone had roughly the same pattern of Xs. (The big ones are big bits of evidence, by the way, and the small ones are relatively minor.)
However, once I got through with the experience I thought that a better approach would be to replace the Xs with actual descriptions of the geology that served as evidence, to reinforce what certain rocks, structures, and landforms mean. So this is the final version I came up with, and the one I intend to use in future iterations of covering this material.
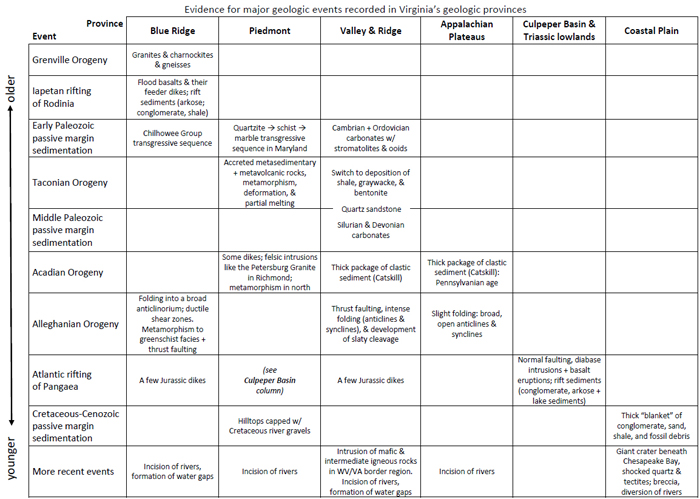
(click through for a full-resolution PDF)
It’s certainly a lot more complicated, and more comprehensive, though there are interesting things it too elides for the sake of space. I feel it’s a decent compromise though – and I feel good enough about it that I intend to keep it for the next go-round.
Those of you who teach or who learn: Have you ever used an approach like this? What was successful about it? How do you think it could be improved? Thanks in advance for sharing your thoughts and your feedback.
I really like this method. It provides a more comprehensive picture of both the events and the timeline. It also would have helped me make better sense of the notes I took. Without a doubt the professors who could more directly involve me in a class on multiple levels are the ones who stood out and whose lessons I still remember today. (You are one of the few that have involved taste, still remember the snickers lesson).
Thanks!
I think this is a terrific strategy for dealing with the conundrum (corundum?) that I have always felt when teaching regional geology – focus on the timeline or go through region by region? Both organizational schemes have advantages and disadvantages, but this allows your students to use either perspective as they fit any new knowledge or experiences into what they have learned.
Yeah; good point. Thanks for expressing it that way.
I like the method, but how are you assessing it? I could see that the X’s method could be pretty quick to grade, but once you add the descriptors I could see this assignment ballooning into a real bear of a “grading jail” effort to assess. Maybe detailed assessment isn’t worth the time it’d take to do it all? Perhaps someone can suggest a better way to assess this than I can see off the top of my head? Ideas welcome!
I’m not grading it. This isn’t a summative assessment; it’s a formative exercise. I went over the X’s at the end of the lecture with a review of my “key” copy of the worksheet, but students then self-checked their own worksheets. It’s not something I collected – I saw it more of a way to force them to structure their thinking about what otherwise might seem an overwhelming mishmash of facts and interpretations.
This is great! I’d maybe flip the age scale…older on the bottom, younger on the top. My mind must be hardwired by decades of teaching superposition and geologic time scale. I use Lynn Fichter’s (my geology mentor at JMU) graphic summary of VA geologic history, rocks in the room I’ve picked up around the state, and interactive PDFs of Virginia’s provinces, igneous, sedimentary, and metamorphic rocks. I made the geologic maps in ArcMap. The PDFs instantly reveal which of the three general rock types is predominantly associated with each of the provinces. The best thing about the PDFs is the rock layers can be clicked off and on. I have the students (each has a laptop) turn off all the layers. Then as I tell the geologic story, Using Fichter’s graphic as my visual guide, I have the students turn on the layers that are the evidence. By the end of our rocks unit the students have learned about Virginia’s rocks within geographic (provinces) and tectonic settings.
I link your geologic history of Virginia YouTube video as a supplement and give start/stop times to students who are absent.
I teach at South Lakes High School. My two Earth Science colleagues also use these lesson materials. This lesson has transformed teaching and learning rocks from a lot of disconnected memorization, to a relevant and fleshed our story, and the rocks become the characters (evidence) that tells the tale in a more meaningful way.
PS: one of my former students, Maddy Rushing, was also your student.
Cool. Thanks, Jon.
Small world, re: Maddy!
You’re not the first who’s suggested a “superposition” reorganization of the chart. I guess I think of this as something intended for a general, introductory North American audience, who are going to be used to starting a narrative at the upper left of a page and proceeding toward lower right. It’s not a stratigraphic column; but if that makes more sense to you, I’d be happy to offer a reorganized version.
I’d love to see the PDFs you use – that sounds really useful. Email them to me at cbentley[AT]nvcc.edu ?
Thanks
John,
I just made “superposition-formatted” versions of all three handouts.
Blank:
With the “X“s filled in:
And with the evidence filled in instead of “X“s:
Hope they are useful!
Callan,
Thanks! I’m going to use it for sure. It’s pretty easy to recalibrate students’ minds by starting off grabing half a dozen textbooks and stacking them one at a time…say “which book was deposited first”….Last?…So if these were layers of rock (like in this photo of the Grand Canyon) which rock layers are the oldest?” Done. In my experience they catch on quickly.
The PDFs are about 5 years old. I want to re do them with an appropriate map projection. They only have a geographic coordinate system (NAD 83) and my cartography skills weren’t what they are now. If you like them and have some thoughts on improvements or additions (faults?) I’ll have greater motivation than simply adding projection.
Super. The projection being update is great, but I doubt that’s critical to make the point of the layers coming in one after the other.
The geologic map PDFs were made using the USGS GIS data set. They are detailed. The only modifications I made were using general terms in place of some of the exotic rock names students can’t understand until they’ve had an igneous and metamorphic petrology course. If you’d like to play with the PDFs I will send them to you.
One commenter (on Facebook) suggested adding dates, so here’s a version with dates added in red:
I like it! I used to (when I was still teaching) give students a chart to fill in to compare the characteristics of different styles of volcanoes/volcanism. I think that charts like this can help students to organize their knowledge into a conceptual framework.
I am a novice and I love geology. I would like to have dates to go in the charts. I always have a problem keeping the time in tact in my mind. Thanks for sharing.
This graphic organizer worksheet tool is excellent!
Jon, I would also love to see those interactive PDFs, too if you are willing to share them.
What resources did you use to construct them? It would be a great student GIS project to do something similar for other areas. In my stomping grounds, I could really use versions for NY and PA and New England.
No problem Amy. If you don’t mind posting an email I’ll send them to you. I used ArcMap (now using 10.51) and geologic map data from the USGS National Geologic Map Database. It should be available here….but it’s not as easy as it should be…https://ngmdb.usgs.gov/ngmdb/ngmdb_home.html
With the right query Google took me right to it (Geologic Map North America): https://ngmdb.usgs.gov/gmna/
NY data appears to be available here:
https://gis.ny.gov/gisdata/inventories/member.cfm?organizationID=975
Your chart fits the flow of where you go and the order you use but I would prefer Pruess’s flip.
Joe
Bull Run Quarry in Northern Virginia. I am intrigued by the layer of brown earth that lies on the massive bedrock. Is this from erosion over the eons from the Blue Ridge mountains, or is it from the fall out from the meteorite 35 million years ago that impacted the now Chesapeake Bay. I’m thinking it can’t be the latter. How old would that layer be? Also, I have come to learn that no dinosaur bones have been found in Virginia, only fossils and tracks. Did Virginia’s dynamic geology play the real role in covering up their bones, and not the meteorite debris? Thank you.